Figure 8-1
Duplicating Font Selections
This chapter describes some ideas for saving time creating charts, and taking full advantage of ChartistÆs features.
When starting a new chart, take the time to set up the default symbol and line properties before you start entering data. This will save having to select the items individually and set them to the desired properties. When you save a chart, the default settings are saved as well. If you take the time to set your default symbol and line properties first, then they will be loaded in correctly each time you edit the file. You can of course change the defaults at any time.

Figure 8-1
Duplicating Font Selections
If you create a symbol that is a variant of one of the standard shapes, for example, a circle from the ellipse shape, or a square from the rectangle shape, you can quickly replicate it with the clipboard. Make a prototype symbol and then copy it to the clipboard. You can then paste the symbol wherever you need it, already set up with the properties you need.
You can extend this technique to text formatting as well. If you are creating a number of symbols with the same text formatting, create the first one, with the desired text and fonts. Copy that symbol to the clipboard, and then paste it where you need it. You can then quickly edit in the new text while keeping the font selections.
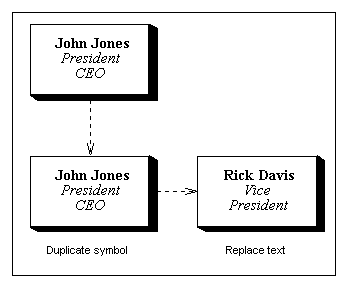
For example assume you are creating an organization chart with the personÆs name in one font on one or two lines, and the title in a separate font on other lines. Create the first symbol with all text and copy it to the clipboard. Paste the symbol copy where you want the next one. Edit a line of text in that symbol by selecting the whole line first. When you start typing, the old text on the line will be deleted, but the font will stay the same. Keep pasting your prototype symbol into each location, and select and edit the lines of text. See Figure 8-1.
By using the plane selection in the Choose Symbol Shape dialog you can create effects such as framing and stacking of symbols. As described in Chapter 4, the plane property determines the order in which charts are drawn. See Figure 8-2.
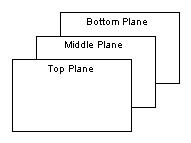
Figure 8-2
Symbol Plane Property Creates Layers
This means that a symbol in a lower plane can serve as a frame for a symbol in a higher plane. In Figure 8-1, the entire picture including the border was drawn in Chartist and pasted into this chapter (as a Metafile Picture). The border is a rectangle shape in the bottom plane, while the other symbols in the figure are in the middle plane. Note that lines are drawn "on top of" all symbols, regardless of their plane.
When selecting symbols that overlap, Chartist always picks the smallest symbol surrounding the point that you click on. The click and drag method of selecting a group will not work on overlapped symbols. You will end up unintentionally dragging symbol to a new location if you try it. Instead use the Symbol Select (F7) command to select parts of an overlapping group. This command temporarily inhibits the click and drag logic for moving symbols in favor of selecting symbols. Using the shift key to keep prior selections also works in this mode.
You can also deactivate one or more of the planes for symbol selection and designation. By unchecking the appropriate plane name in the Options menu, you can make the system ignore mouse clicks on symbols in that plane. This makes working with multiple layers easier.
Bitmaps are files that contain rectangular arrays of pixels. Each pixel may be black or white or a color depending on the type of bitmap. As described in Chapter 4, Chartist will load a Windows device independent bitmap file into a symbol. This bitmap replaces the background of the symbol. When color bitmaps are drawn in the chart they are copied directly into the display, to preserve the color selections. When monochrome bitmaps are drawn in the chart they are "ANDED" with the display data already present. This process tends to let anything underlying the monochrome bitmap to show through. See Figure 8-3.
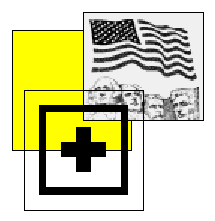
Figure 8-3
Underlying Symbols Show Through a Monochrome Bitmap
Generally it is better not to put text into a symbol that has a bitmap in it. Text is placed into a symbol on top of any background, bitmap or selected color. Whether text is readable on top of a bitmap depends, of course, on the bitmap and the text. Remember the layering techniques described above to build composite symbols and provide clear areas for text and bitmaps.
Remember that bitmaps can be very large files. When you load a bitmap file into a symbol, it is copied in its entirety into the Chartist document. Certain Windows bitmap files may be compressed using run length encoding. If they are compressed, they will remain so in Chartist. Chartist does not modify device independent bitmap data bits in any manner.
Often while editing a chart, you may need to separate a group of symbols to make room for more. You can accomplish this by using the Symbol Select To End commands. These commands select all symbols from the coordinate of the currently selected symbol to the end of the chart, in the direction indicated by the command (Right, Left, Up, Down).
Once selected, use the Symbol Move command to move the entire group as desired. Remember that the cursor is positioned at the top left corner of the group when moving.
To place text in the drawing anywhere, use the "Titl-Cent" shape. This shape has a phantom line border on the display. When printed, however, it has no border.
Any lines connected to a Titl-Cent shape will go all the way to the center of it. This provides a second use of this shape as a Waypoint for lines, allowing you to nail down lines at certain points. See elsewhere in this document for the Waypoint.
The application automatically takes care of most jogging and merging situations. If you are connecting from a symbol to several symbols on multiple levels, in an organization chart, for example, be sure to leave enough vertical space between the top symbol and the first row. If you do not leave enough space, the jog points will not merge.
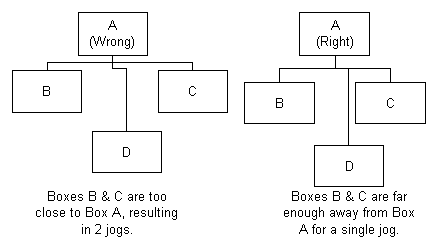
Figure 8-4
Merging Line Jogs
How do you get a line from the bottom of diamond B to the top of Box A, which is in the same column? See Figure 8-5.
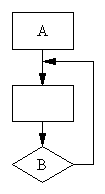
Figure 8-5
Column Wrap Routing
Step 1: Add a line from the bottom of B to the top of A. Do not worry about how it looks, yet. See Figure 8-6.
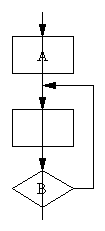
Figure 8-6.
Column Wrap, Step 1.
Step 2: Select the line (click near top), and use the Line Add Waypoint command. The waypoint is shown below as a gray rectangle, for clarity. See Figure 8-7

Figure 8-7
Column Wrap, Step 2.
Step 3: Click on the waypoint (little box) and drag it over, to the left in this case.
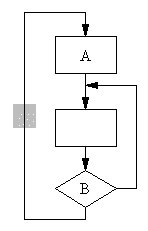
Figure 8-8.
Column Wrap, Step 3.